The New Zealand Motorhome Market
Market structure, pricing and outlook—combining registrations, ownership transfers, rental-fleet disclosures, advertised inventory and demographic capacity.
Executive Summary
There is no single motorhome market. The 56,086 active motor caravans at June 2026 include coachbuilts, campervans, buses, truck conversions and home-built vehicles. Rental purchasing follows tourism; private new sales follow household wealth and price; used transfers follow the stock already in ownership.
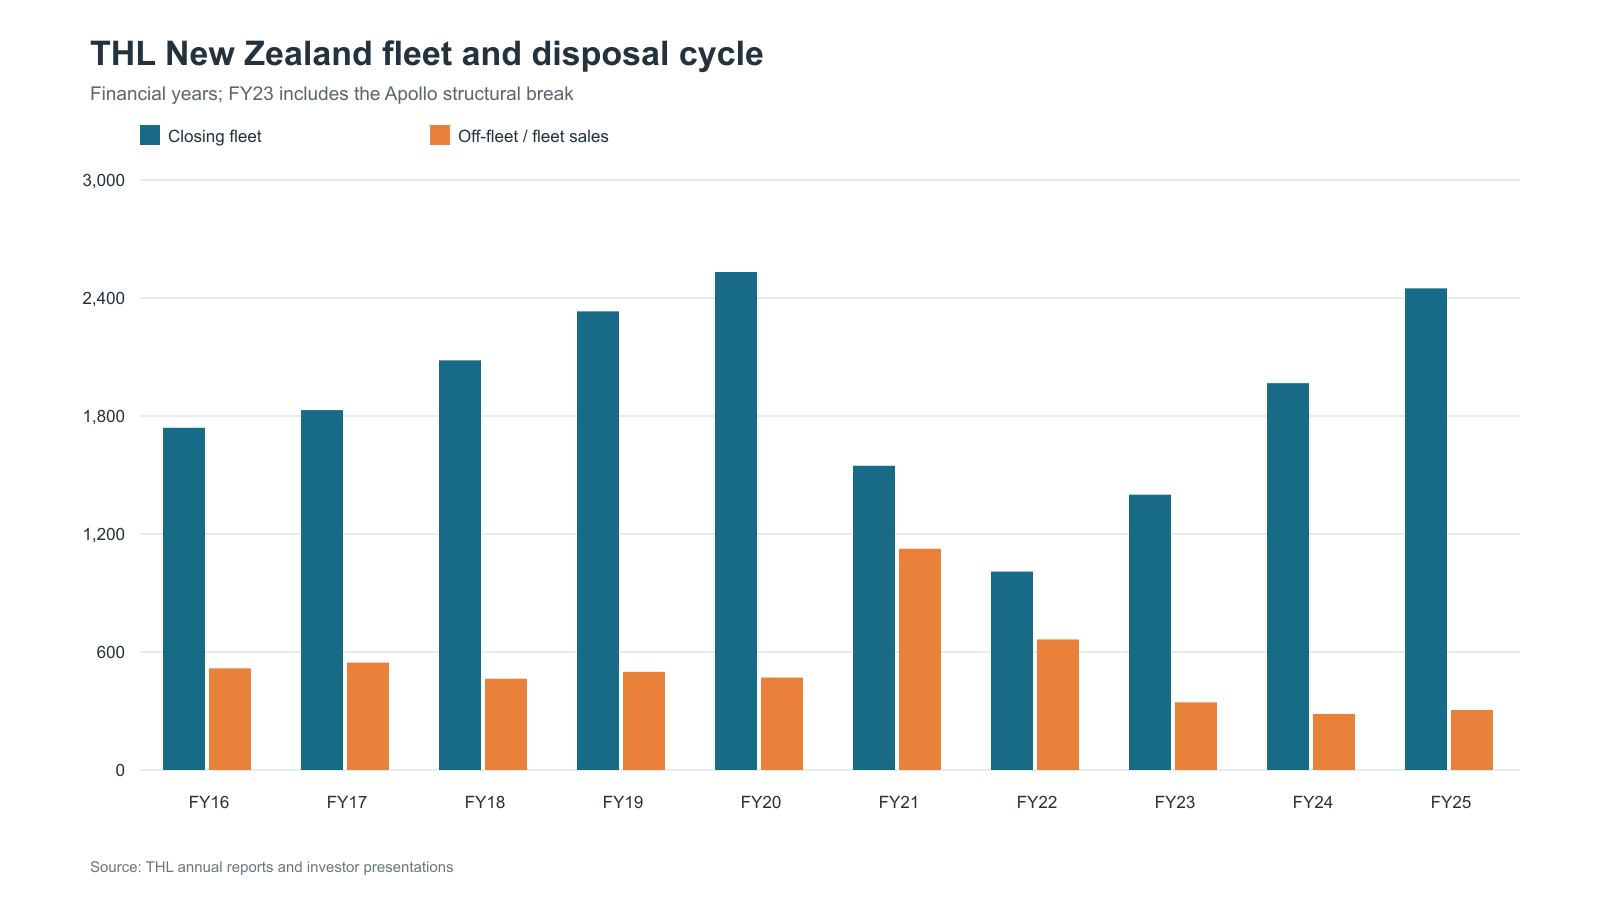
The current growth cycle is increasingly rental-led. Operators contracted after the border closed, then rebuilt when tourism returned. THL's acquisition of Apollo changed ownership within the industry, so not all reported THL growth was national fleet growth.
New European pricing is restricting private conversion. A representative European four-berth model rose from about $136,000 in 2020 to $206,300 in 2026, supporting recent-used values and redirecting buyers away from new.
Absorption is the sustainability test. Every new private vehicle, used import and rental disposal ultimately needs a new private ownership position.
Rental purchasing becomes future private supply
Fleet standardisation helps rental advertising and maintenance, but large groups of the same layout, age and mileage are harder to dispose of. A six-berth overcab that works for rental occupancy may not suit a retired private couple.
A more market-aware strategy would favour compact four-berth layouts, monthly release rather than one seasonal wave, and disposal timing matched to private absorption.
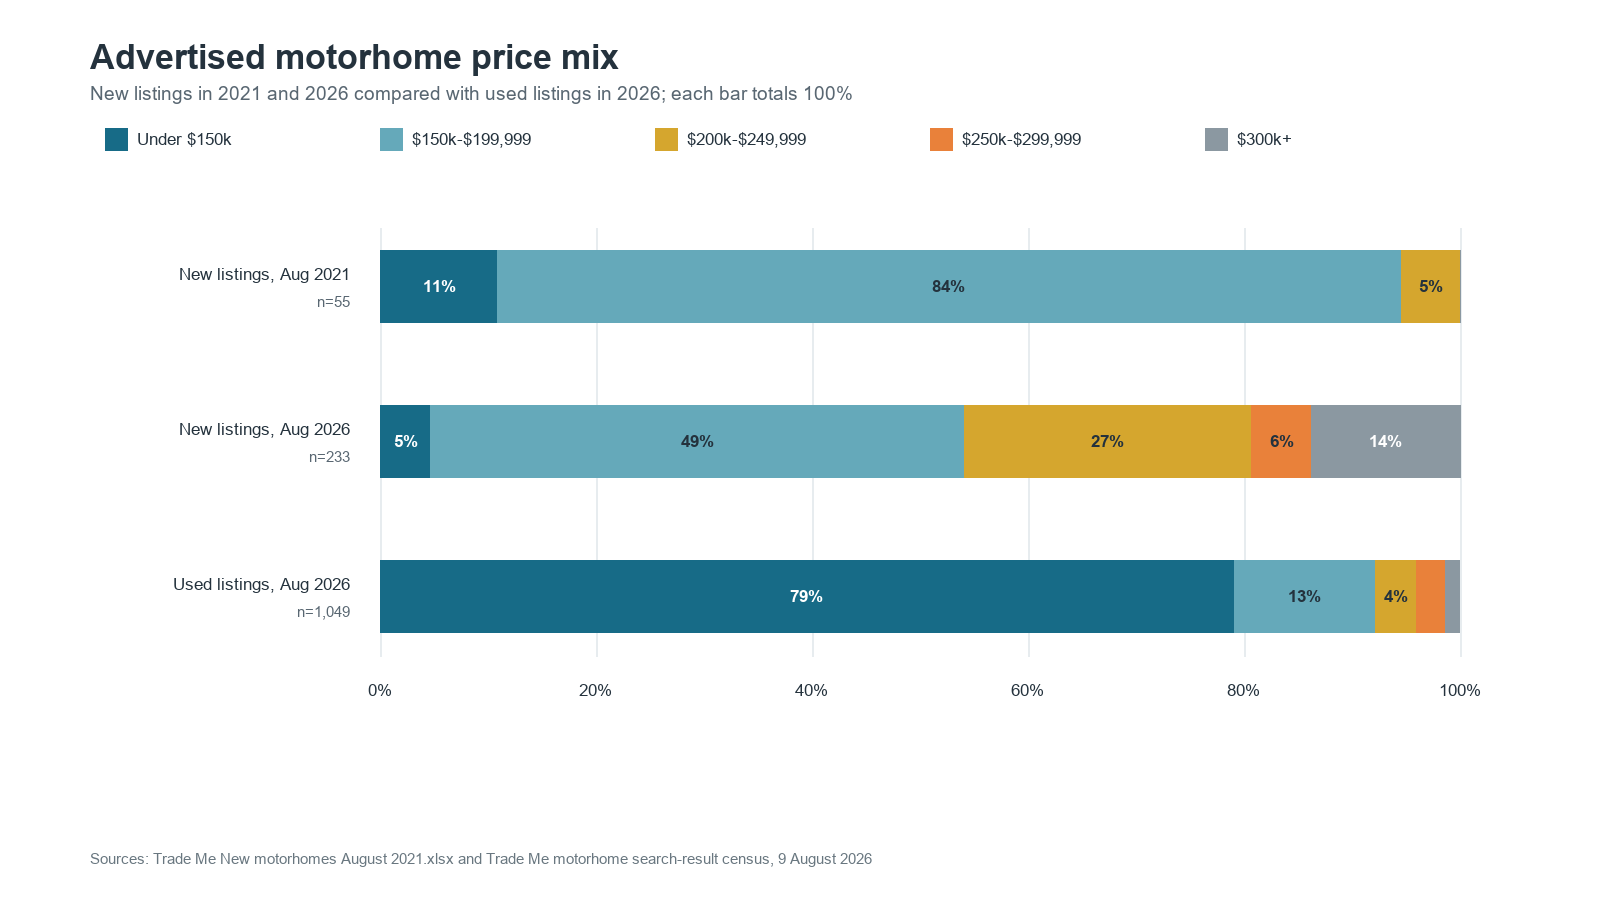
The market moved through the $200,000 threshold
In August 2021, 52 of 55 confirmed 2021-model advertisements were below $200,000 and 28 sat between $150,000 and $169,999. By 2026, the new-market distribution had shifted sharply upward.
The commercial opening is below current European pricing. Maxus tests a lower entry point; Roadcraft tests local design and support; Jayco combines a full-line range with an established after-sales network.
Evidence note: Trade Me snapshots, public price offers and anonymised transaction modelling. Asking prices do not establish achieved dealer margin.
The dealer channel is the narrowest point
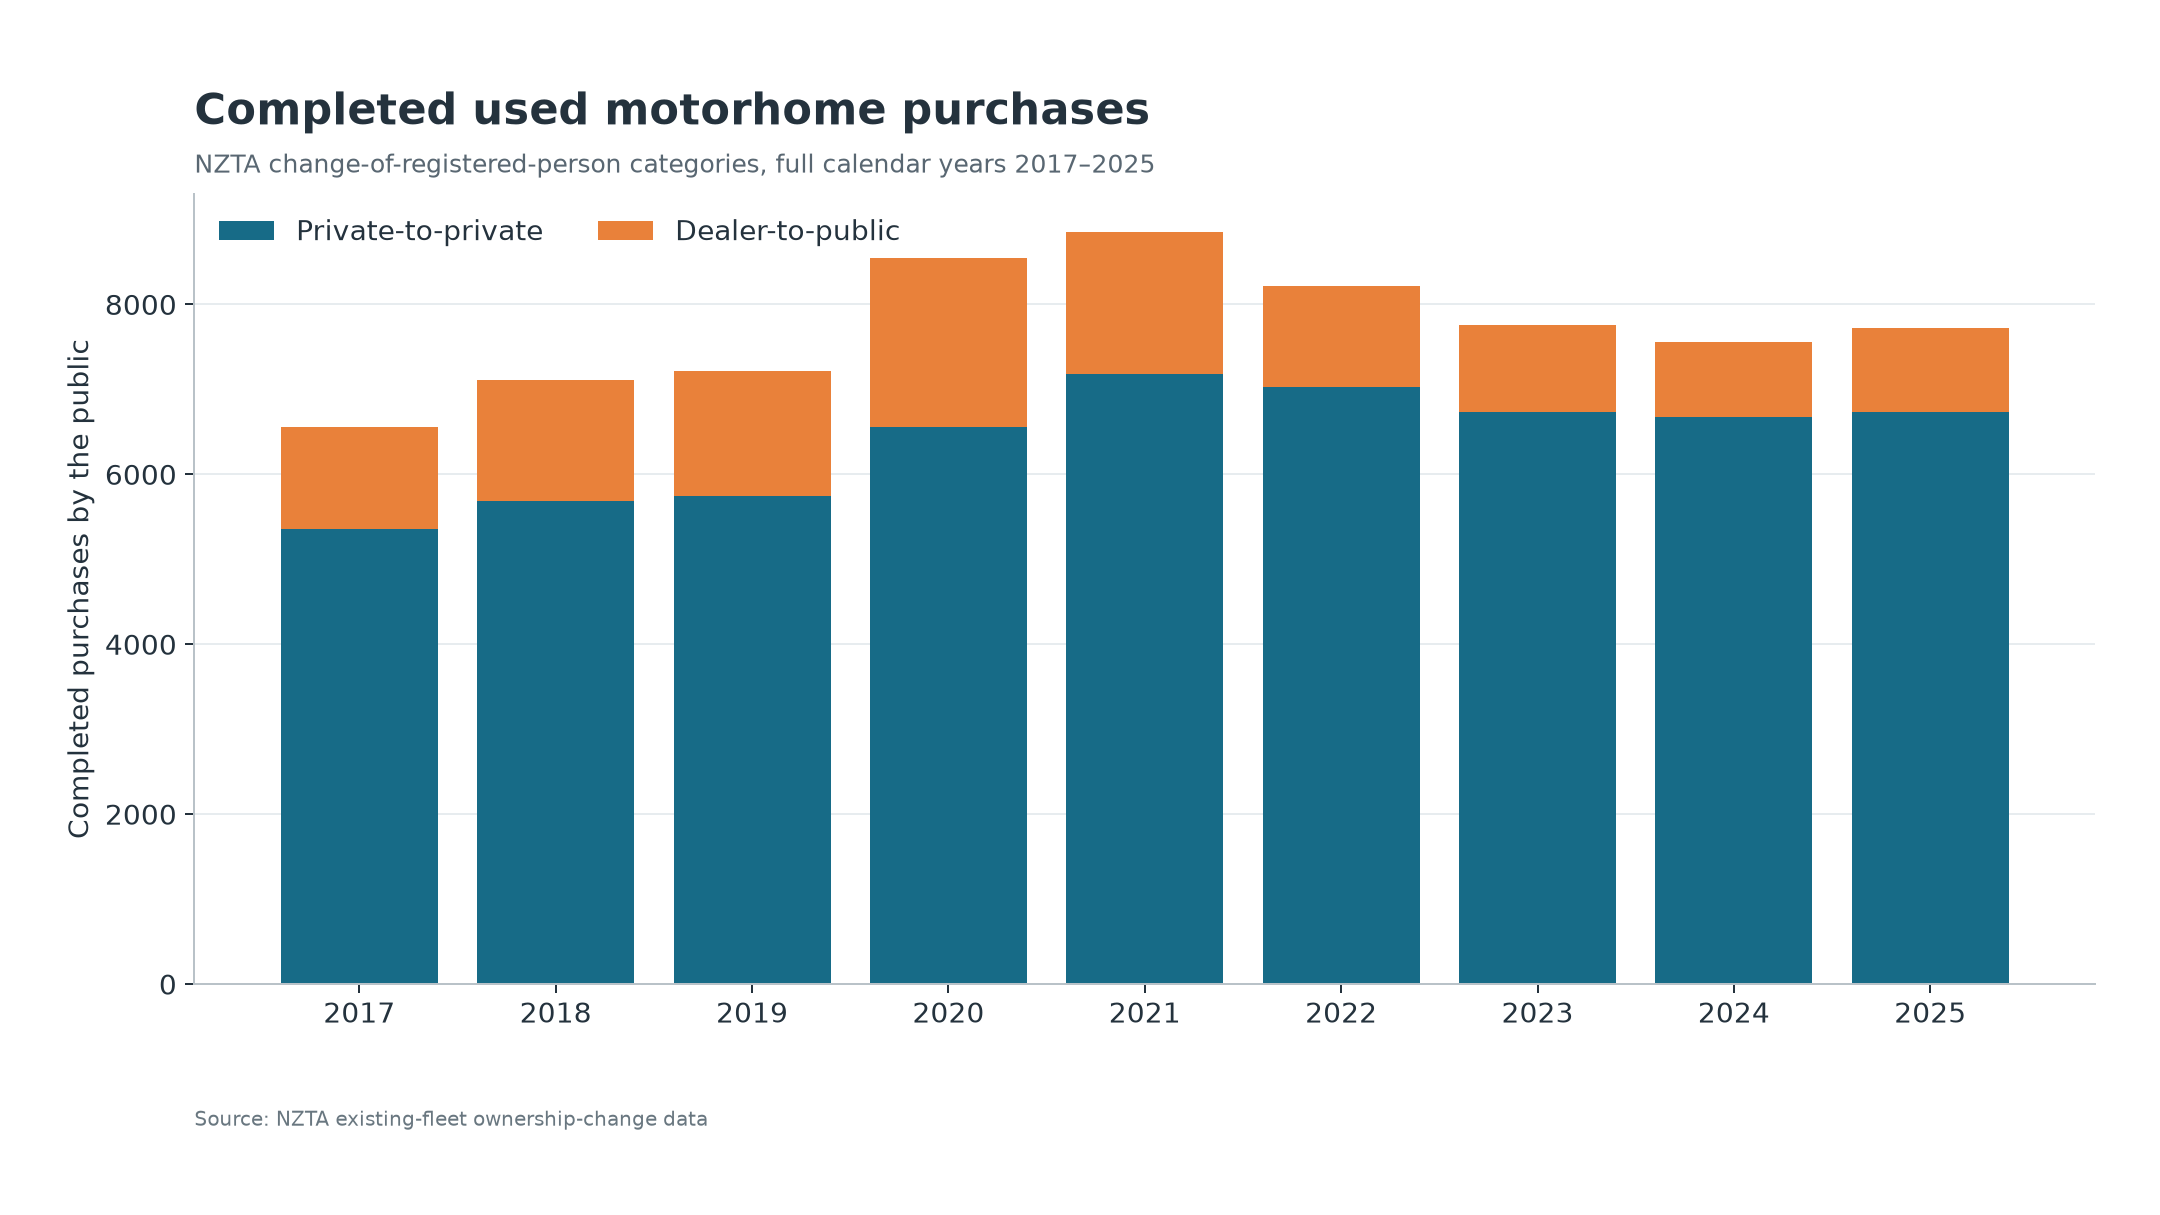
Of 8,600 motorhome ownership transfers in 2025, 6,735 were public-to-public and 988 trader-to-public. Among purchases by the public, traders supplied 12.8%, versus 28.0% for cars and vans.
THL's 241 FY25 ex-rental retail sales are equivalent to an indicative 24.4% of the 2025 trader-to-public channel. The periods and vehicle definitions differ, so this establishes scale rather than an exact RV Super Centre market share.
Slow stock turn, CGA exposure, floor-plan cost and habitation risk are not offset by the same service, parts and finance income available to car dealerships.
Demographic growth supports—but does not guarantee—absorption
The central estimate is 663,000 households containing at least one person aged 65 or over in 2026. Against 49,783 private-use motor caravans, that is about 75 vehicles per 1,000 older households.
At unchanged penetration, household growth could absorb about 1,430 additional private vehicles a year to 2033. If incoming retirees' ownership propensity is 5% lower, capacity falls to about 1,000 a year.
Priorities from the evidence
Measure completed sales, manage rental releases, rebuild an affordable entry offer, strengthen used-dealer trust and track household purchasing capacity.
Regional ownership reinforces the demographic picture
Tauranga and Western Bay of Plenty have about 64% more privately used motorhomes per resident than New Zealand overall. Across 67 districts and cities, motorhome penetration is strongly associated with the share of residents aged 65+ (correlation 0.82). This is an area-level relationship, not a measurement of owners’ retirement status.
Explore regional ownership and compare dealer catchments ↗
Evidence note: June 2026 NZTA fleet matched to June 2025 Stats NZ population. This website update supplements the September 2026 downloadable report.
Request the complete report
Updated 28 September 2026 with the THL annual results, rental acquisition and disposal analysis, RV Super Centre pricing, and revised market conclusions. The complete study brings the evidence into one market story: ten-year development, THL and rental-fleet influence, dealer economics, new and used pricing, demographic absorption, caravans and strategic outlook.
- 44 pages of analysis and market context
- Registration, ownership-transfer and fleet evidence
- Pricing, inventory and demographic charts
- Publication-ready PDF format
Access to the report does not require marketing consent.